Navigating the Dashboard
The dashboard is the home of your SURF browser. From here you can monitor and manage your company’s security features and employee access.
Each section of the dashboard operates to allow you full functionality of your SURF browser.
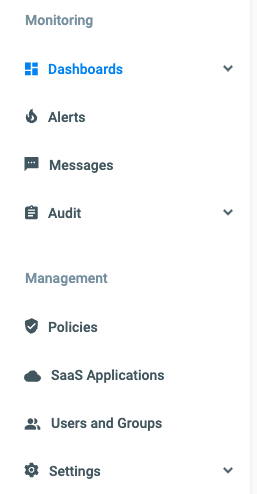
| Menu Options | Descriptions |
| Dashboard | The default home to SURF where the security and performance insights of your organisation are presented. |
| Alerts | All blocked events and forbidden zones, according to your policies, are displayed. Alert status and policy changes can be enacted as a response. |
| Messages | Displays messages and queries from users of your browser. |
| Audit | All functions of the SURF browser will be logged across five sections: • Change Logs - presents the recent policy and browser changes. • Malware Logs - presents the recent malware software viewed on the browser. • Performance Logs - presents the activity of each user. • Navigation History - presents the navigation history of each user. • AI tool Usage - presents the AI tools used within the browser, by individual users. |
| Policies | Customize and update the security policies your SURF browser needs in this interface. Where organisation-wide policies can be implemented and updated. |
| SaaS Applications | Presents the software services users used with the SURF browser and their activity. |
| Users and Groups | Management of all users and groups using your SURF browser. Organisation groups with individual policies can be created. |
| Settings | All settings of the SURF browser can be updated here across three sections: • Integrations - access possible integrations for your SURF browser. • Global thresholds - update the settings of the security and performance reports. • Additional Setup - all other changes to the SURF browser. •Approved Application- A list of apps that are approved for users to work with and authenticate to; this will be reflected in the Shadow IT report. |