Performance Logs
The Performance log audit is used to see the individual performance of each user. This can include their history and activity but it also presents insights into CPUs, ping times, browser extensions, etc.

When an administrator enters the Performance logs audit, each user is presented with initial information; user name, ping time, CPU usage, SURF version use, status, last seen and OS in use.
The administrator can also search for a specific user in the search bar highlighted above.
To see the specific individual user information, the admin can press on the eye symbol in the user’s action column:

The admin will then be presented with the user’s CIO dashboard that presents all relevent information on the user’s performances and use of the SURF browser:
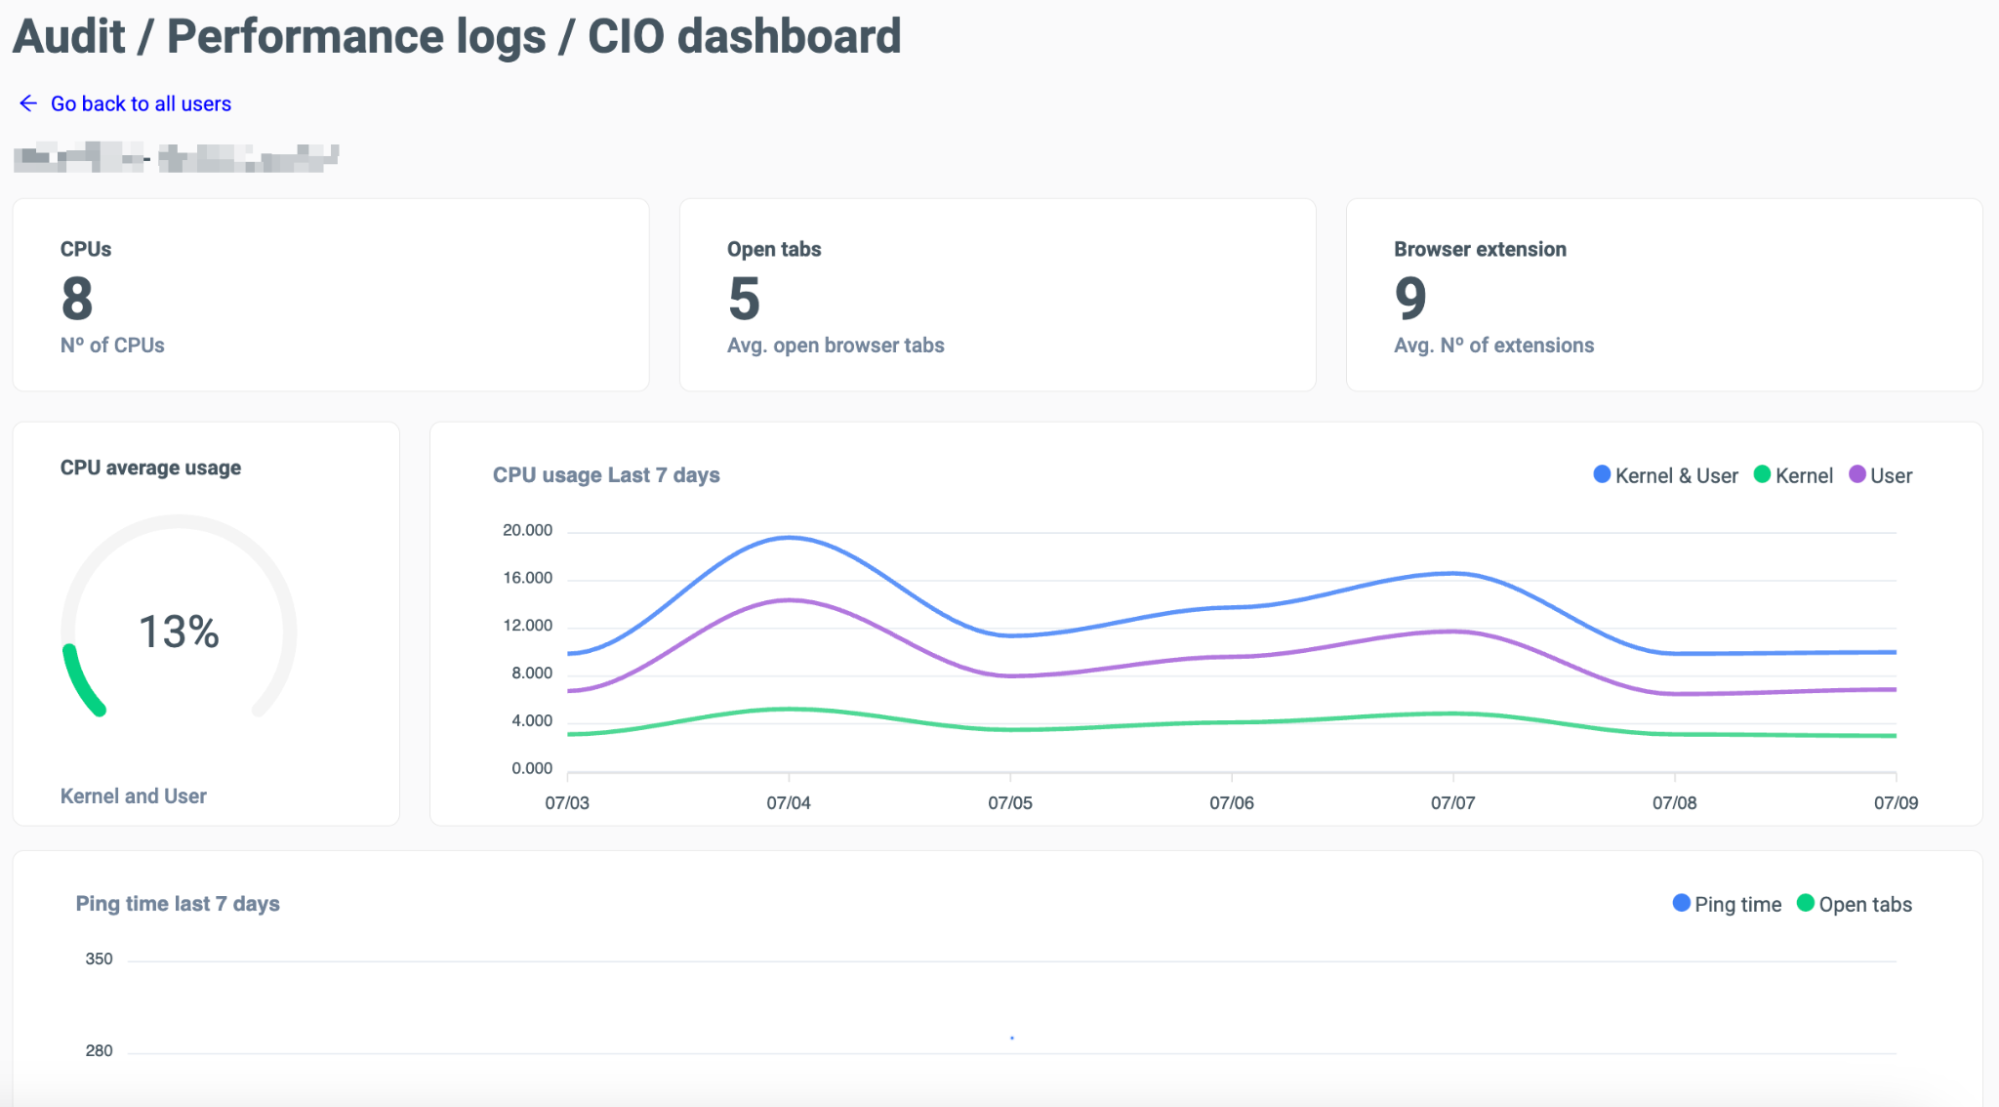
The user’s use of the browser is presented similarly to the administrator’s dashboard. The CPUs, average open table and browser extensions are presented in the top toolbar. Then CPU usage and ping time below.
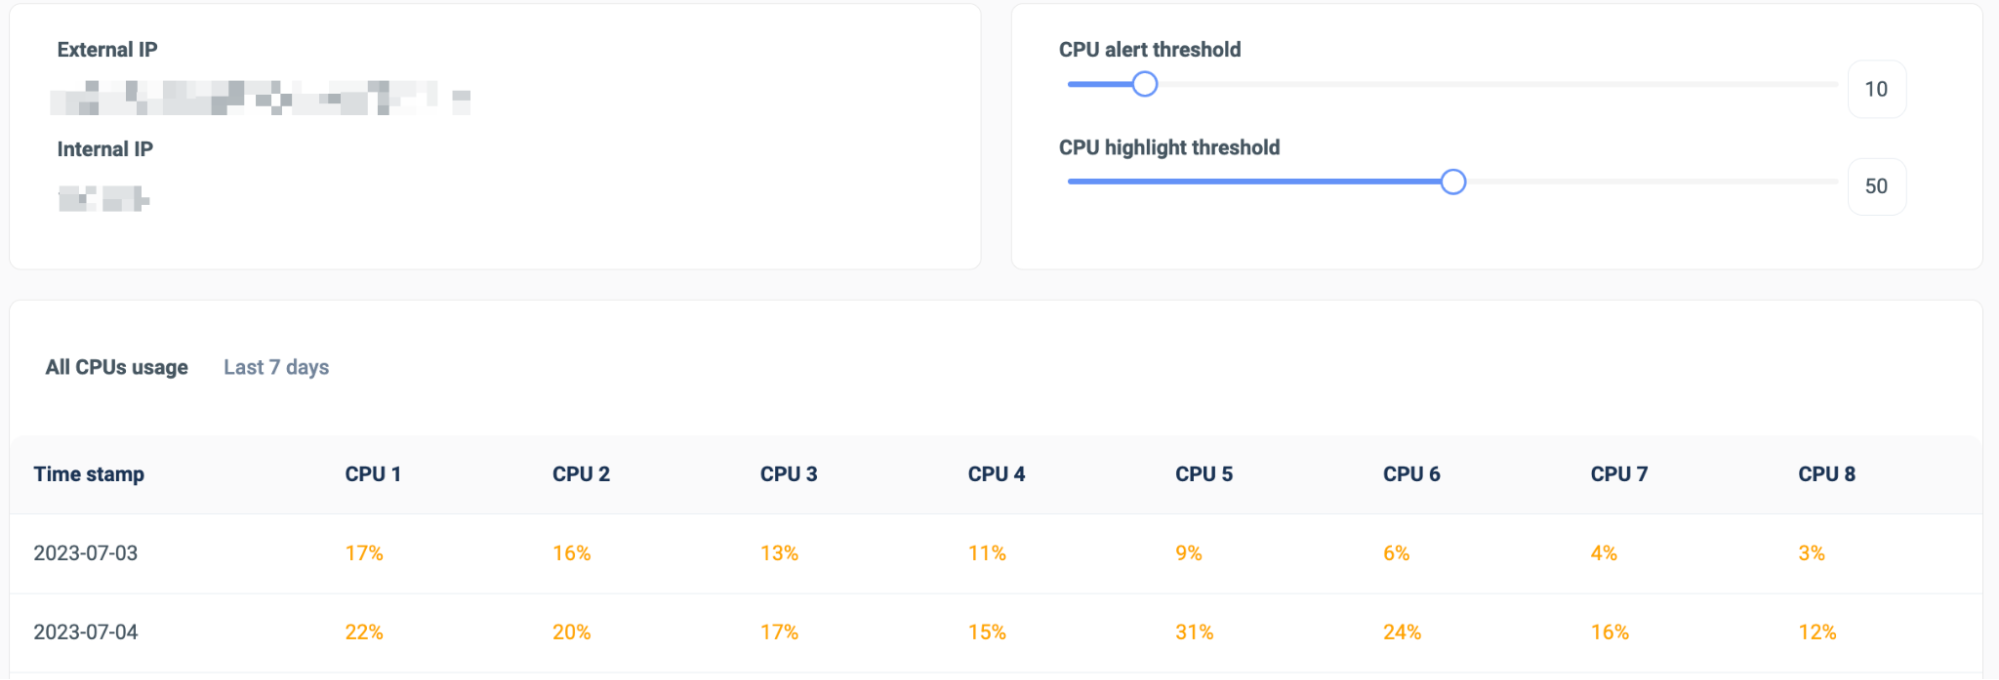
The user’s IP, thresholds, specific CPUs usage and browser extensions are also displayed in differing levels of insight.

As well as being able to see overall and individual user navigation history in the Navigation History Audit, individual navigation history is presented at the bottom of the user’s CIO dashboard:
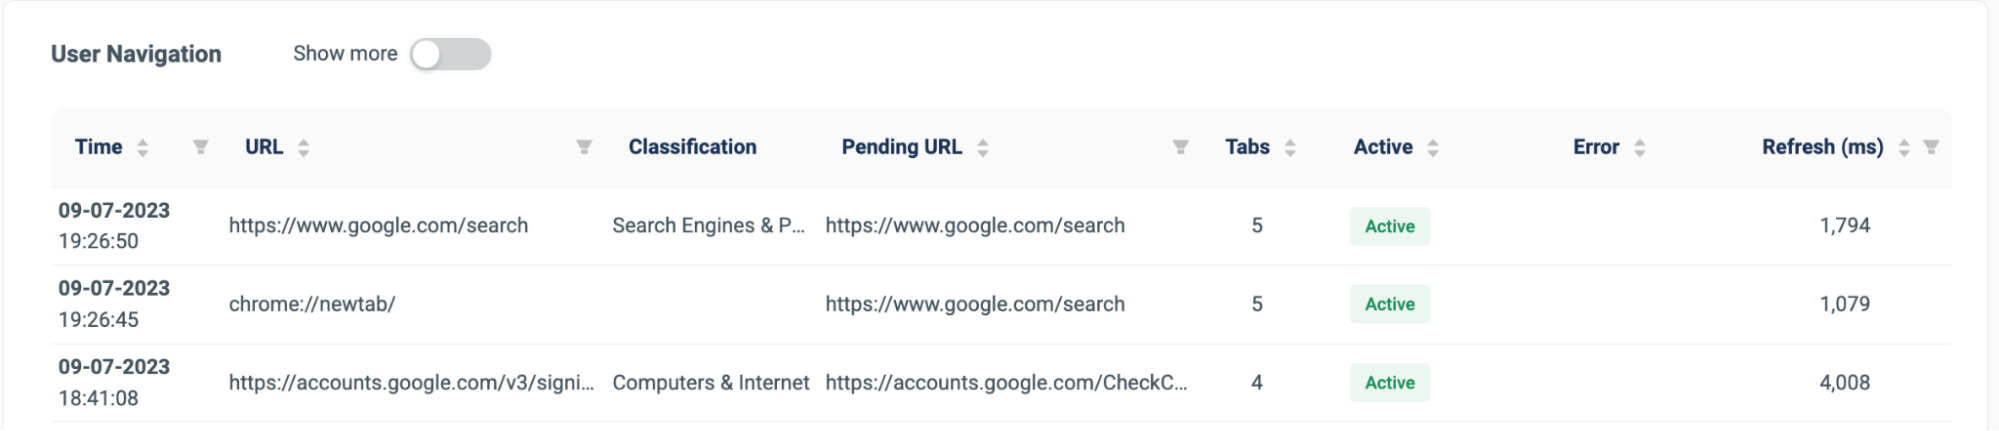
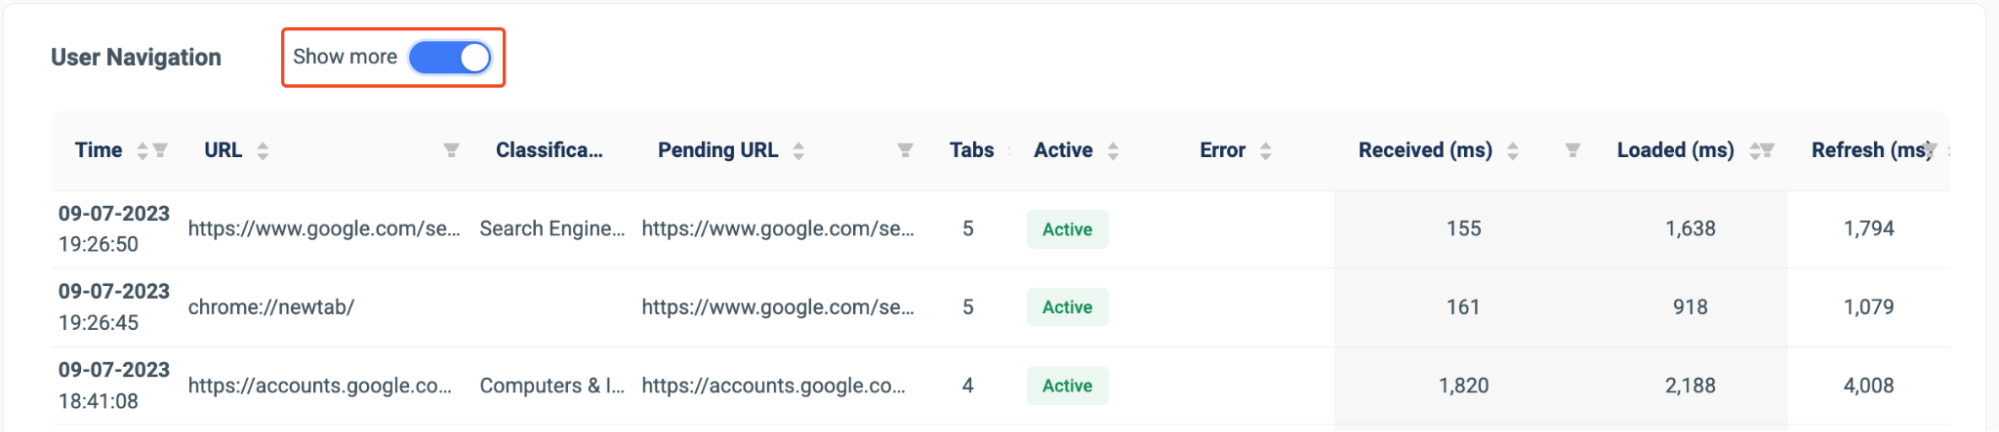
When the ‘Show more’ toggle is selected, highlighted below, the administrator can see additional information of user events, such as their classification, refresh rate, etc.