Security Report
The top right bar is the current insights into your organisation and browser:
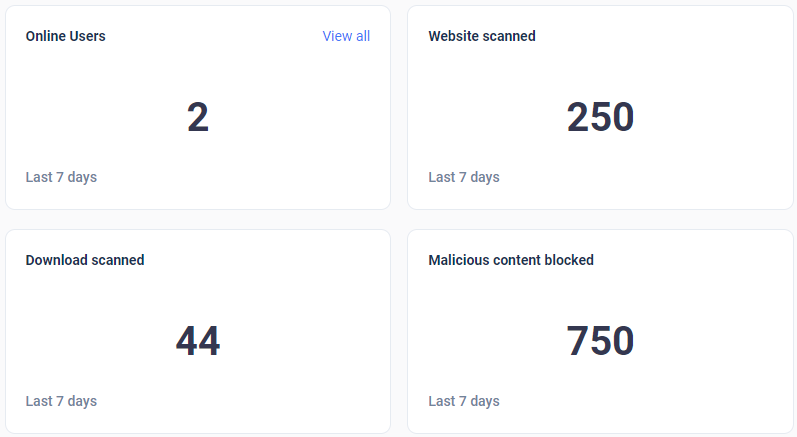
- The number of:
- Online Users - the amount of users online at the given moment.
- Websites scanned - the amount of websites scanned at the given moment.
- Download scanned - the amount of downloads scanned at the given moment.
- Malicious content blocked - the amount of malicious content blocked at the given moment.
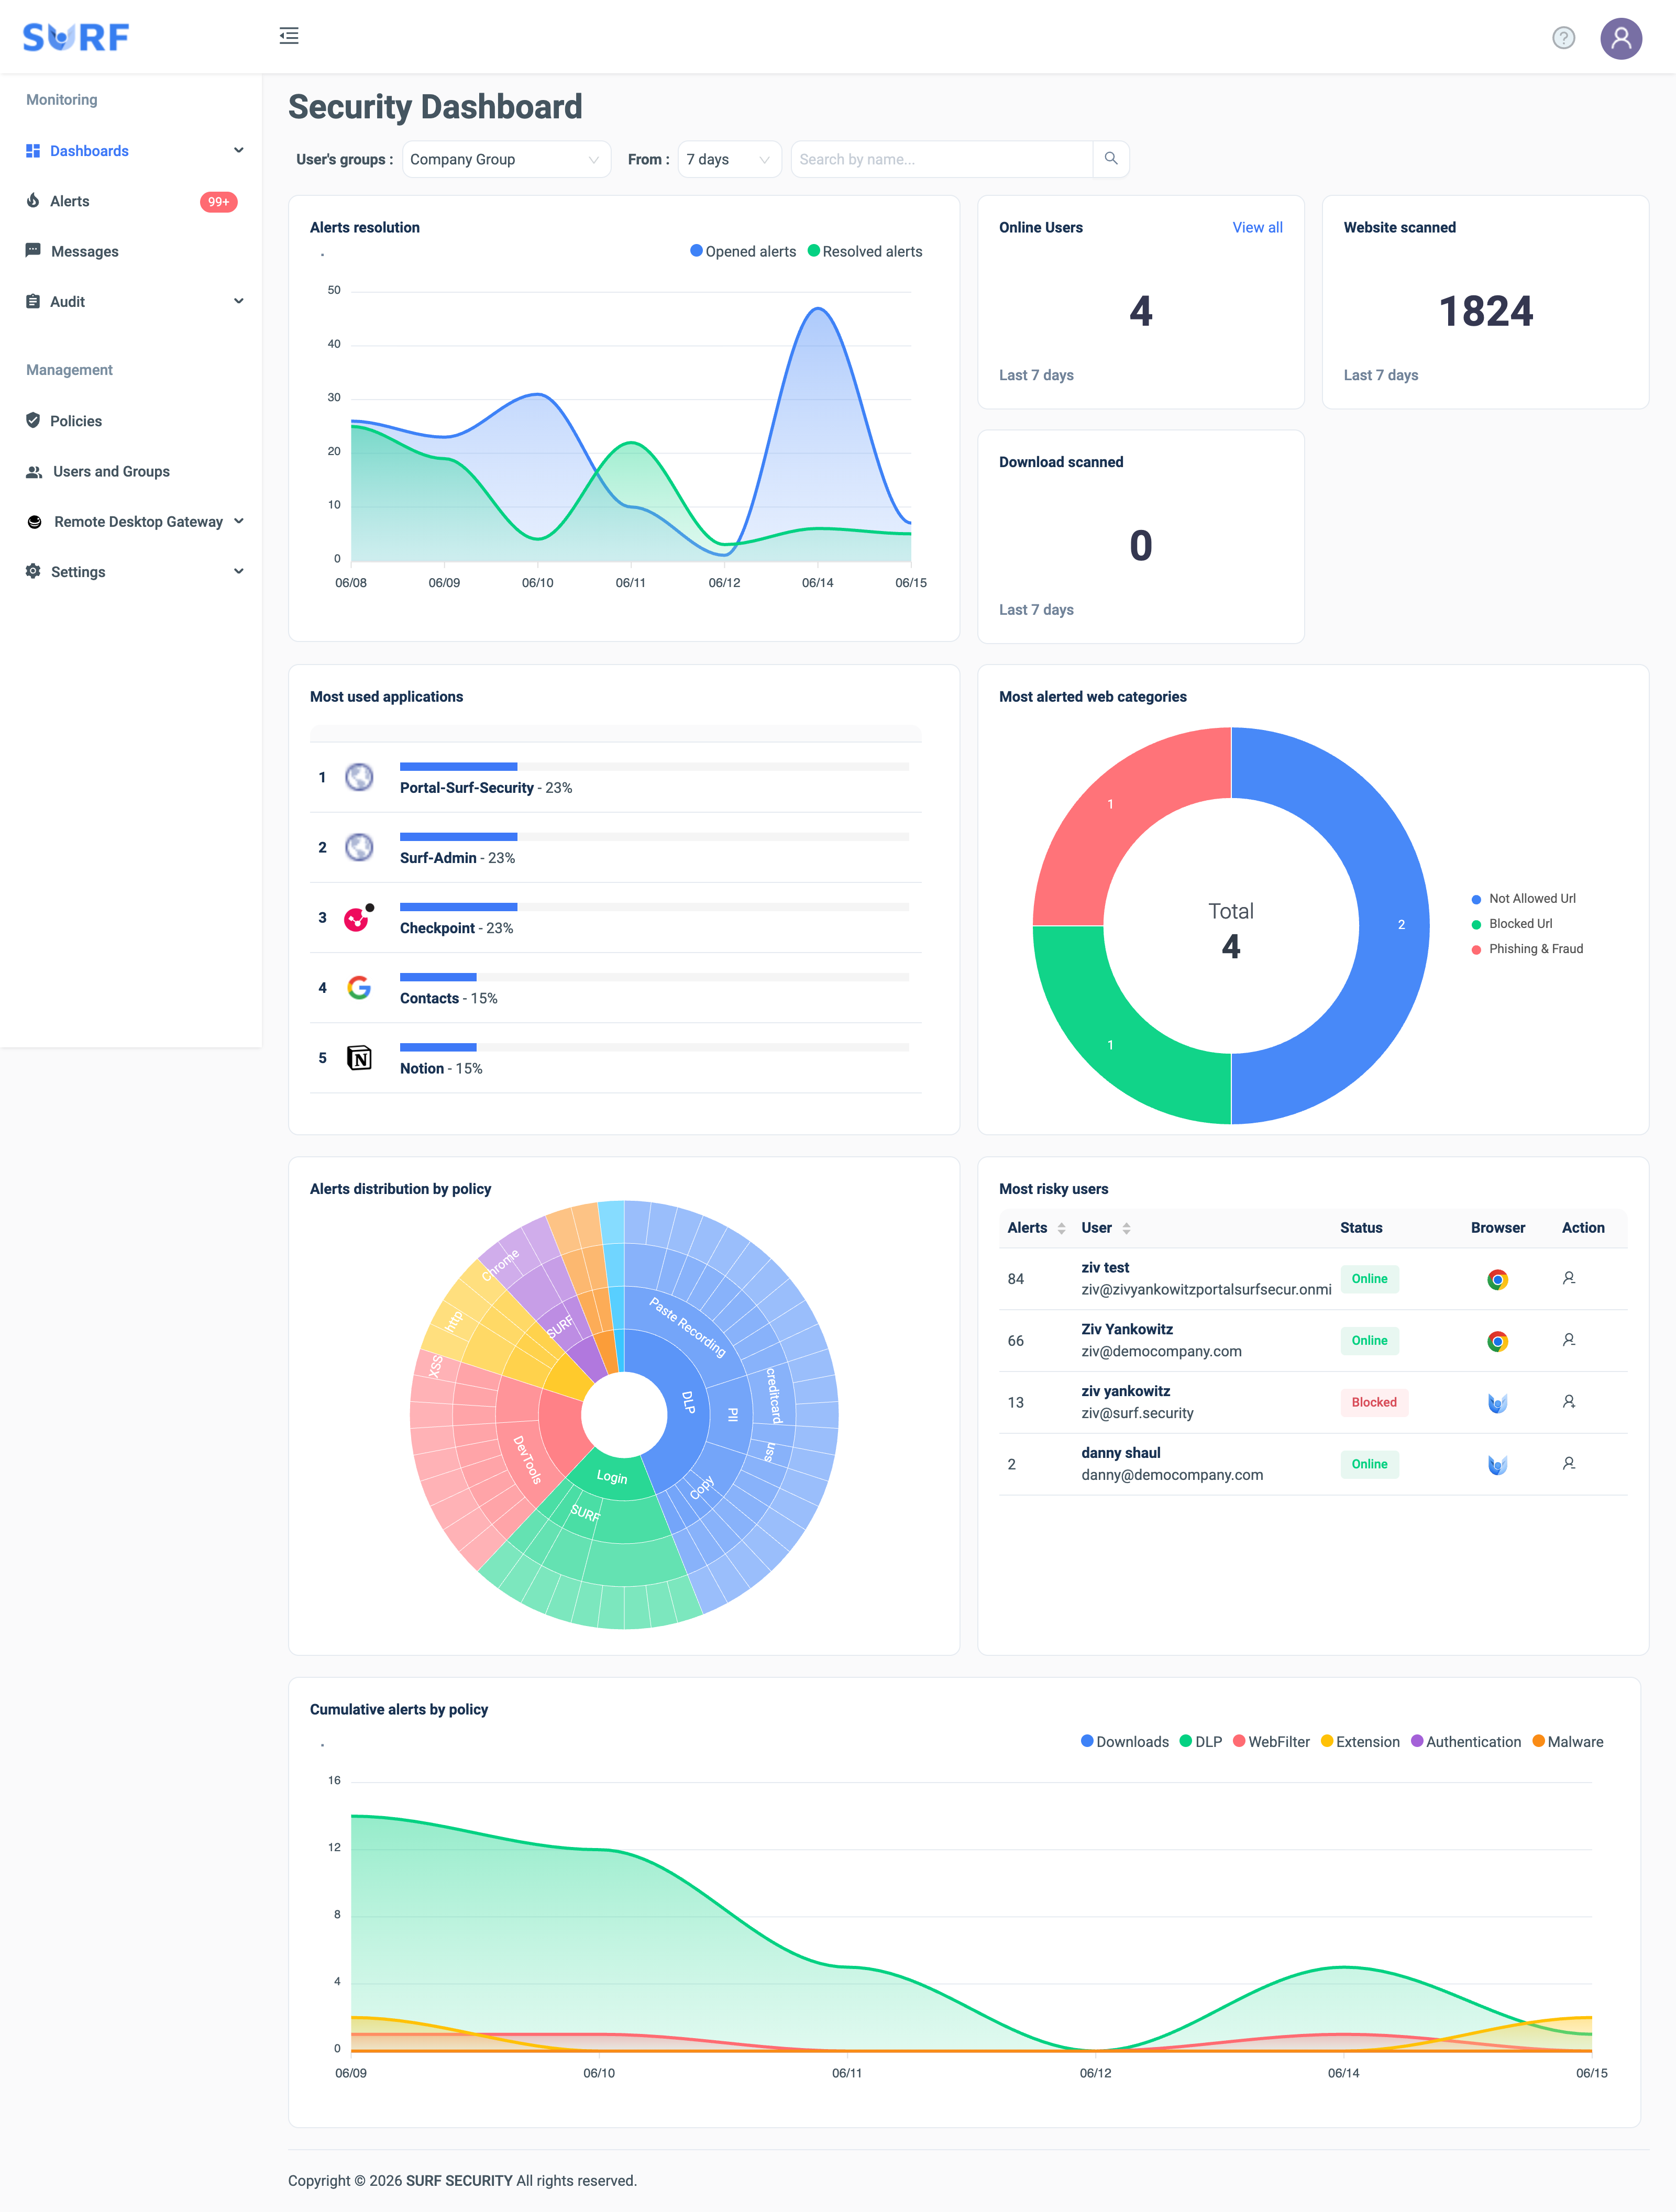
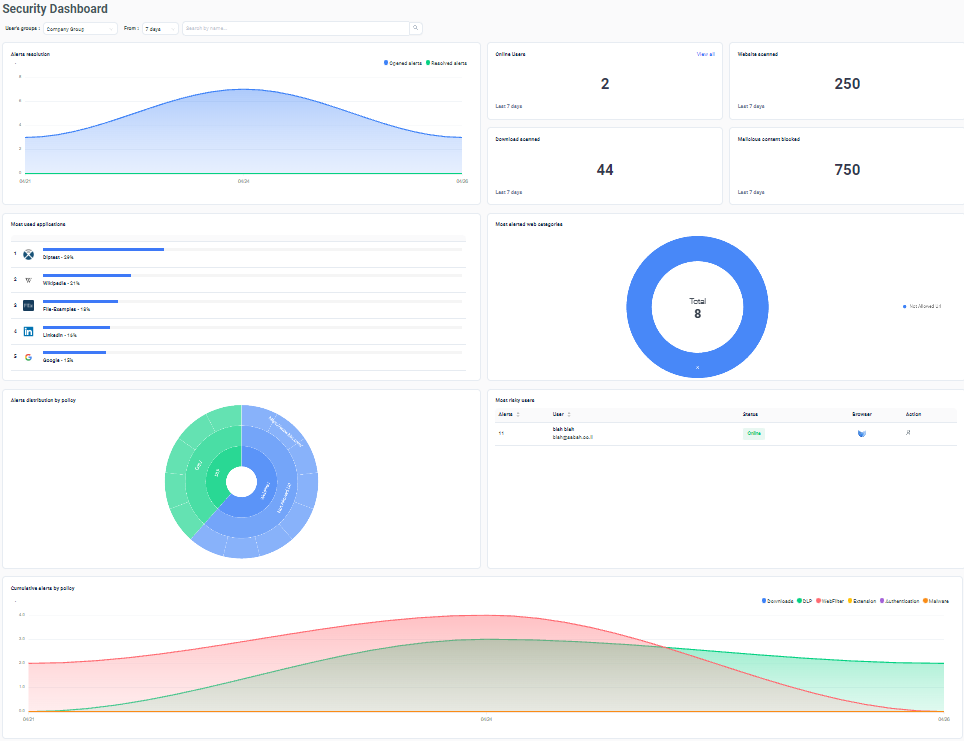
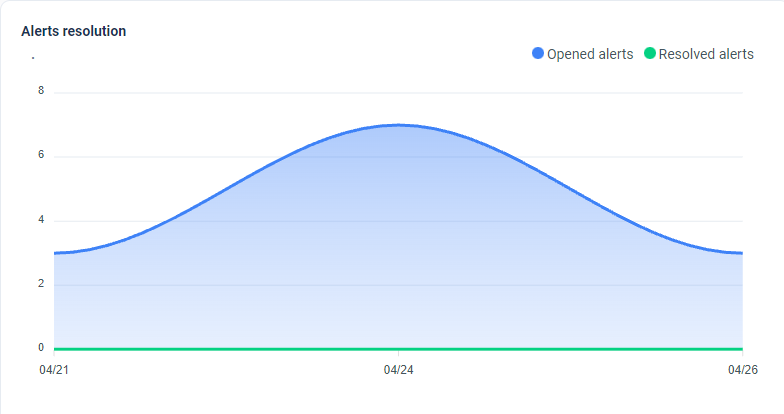
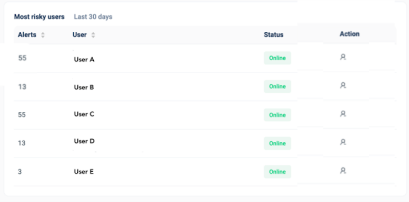
The graphs below presents the overall alerts resolution (left side) of all users and the individual availability and “online-ness” of each user (right side):
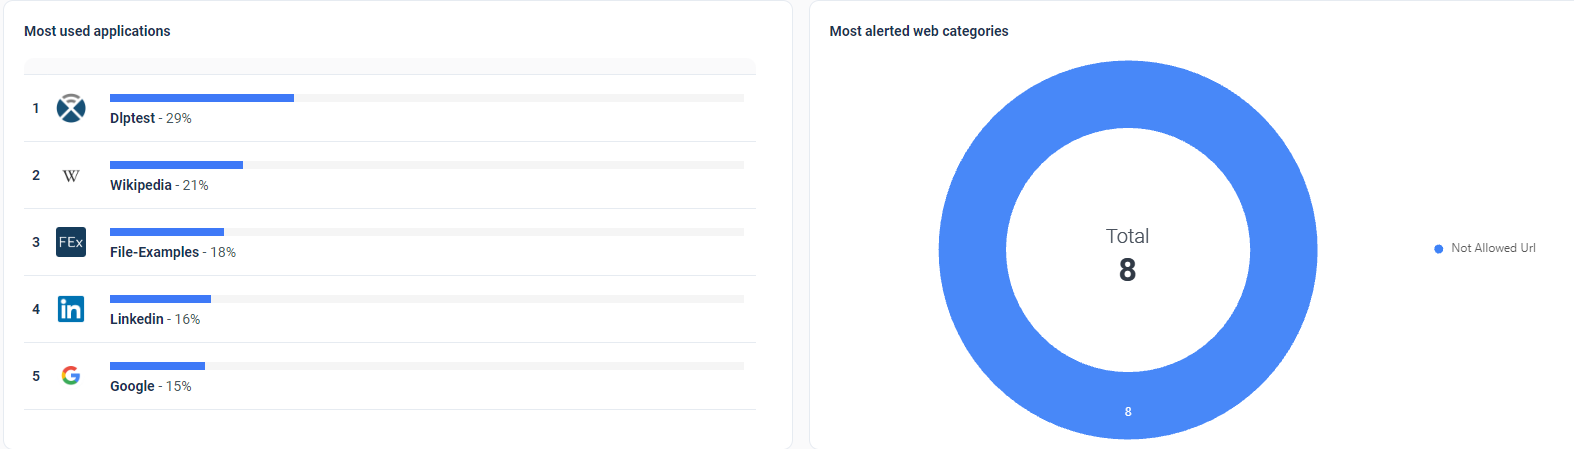
The graphs below show the most used applications (left side) and most alerted web categories (right side) at the given moment.
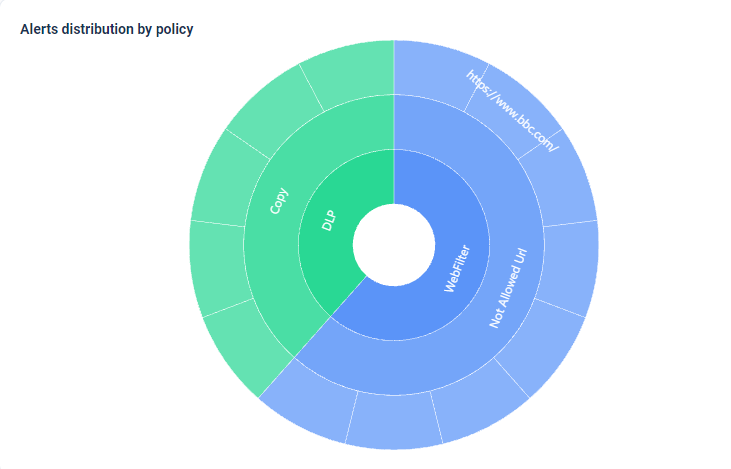
The alerts distribution by policy is presented in a sunburst chart:
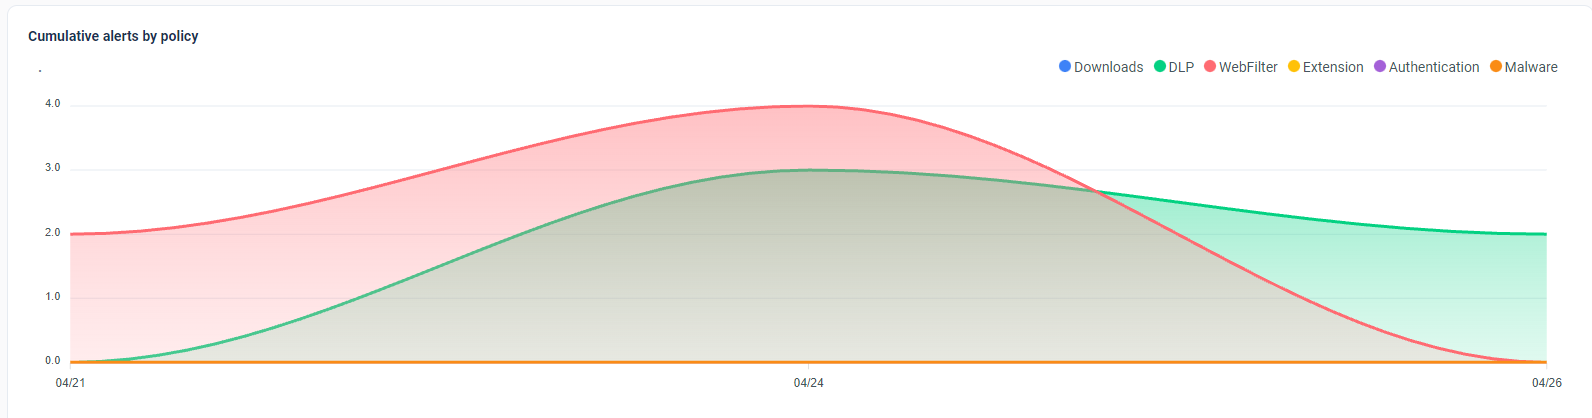
The cumulative alerts by policy presented underneath:
- Shared-account (credential-sharing) evidence — a count of other users on the same shared login plus a drill-down of who shared it; sensitive-prompt settings are role-restricted (Super Admin / Product Owner).
- Sortable detail tables — sort the show-more-details tables (file transfers, logins, blocked logins, sensitive prompts, shared accounts) by any column.
- Audited admin actions — Shadow AI/IT admin actions are recorded in the Change Log: SaaS app approve/unapprove, sensitive-prompt mask-setting changes, and unmask (decrypt) attempts incl. data types revealed.